引言
光光展示数据对可视化来说,远远不够。还有其他很多信息能够帮助读者解释你的数据。除了标签、坐标轴、图例外,还能够增加注释,比如强调图画的某一区域,添加描述性
引言
光光展示数据对可视化来说,远远不够。还有其他很多信息能够帮助读者解释你的数据。除了标签、坐标轴、图例外,还能够增加注释,比如强调图画的某一区域,添加描述性文本等。
添加文本注释
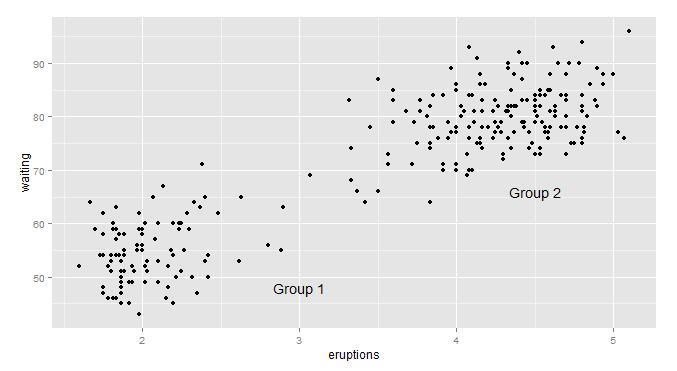
你可以在图形中添加文本,增加可读性。我们在annotate函数中设置text参数即可。
library(ggplot2)
library(gcookbook)
p <- ggplot(faithful, aes(x=eruptions, y=waiting)) + geom_point()
p + annotate("text", x=3, y=48, label="Group 1") +
annotate("text", x=4.5, y=66, label="Group 2")
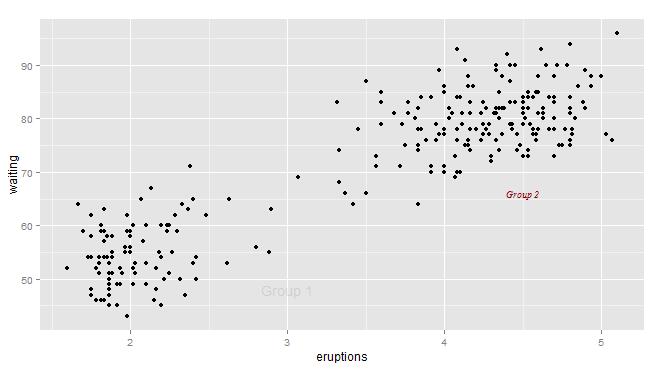
#由于设置的文本会覆盖原来的图中对应的位置,可以改变文本的透明度或者颜色
p + annotate("text", x=3, y=48, label="Group 1", alpha=.1) +
 annotate("text", x=4.5, y=66, label="Group 2", family="serif",
fontface="italic", colour="darkred", size=3)
添加数学表达式注释
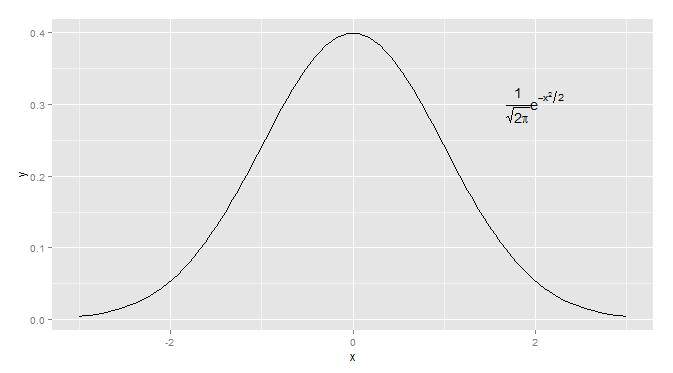
我们也可以在图形中注释数学表达式。在annotate中增加parse=TRUE参数即可。
p <- ggplot(data.frame(x=c(-3,3)), aes(x=x)) + stat_function(fun = dnorm)
p + annotate("text", x=2, y=0.3, parse=TRUE,
label="frac(1, sqrt(2 * pi)) * e ^ {-x^2 / 2}")
#?plotmath可以见到更多使用数学表达式的例子。
添加线条
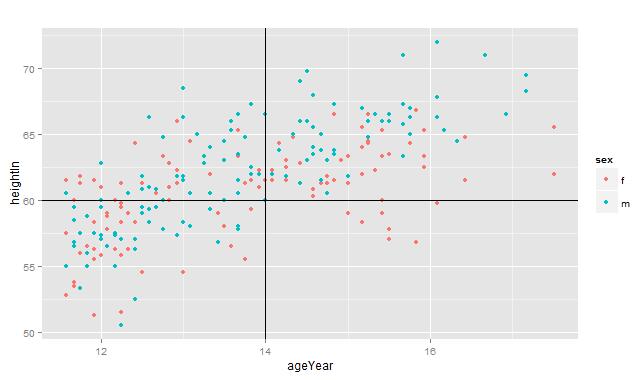
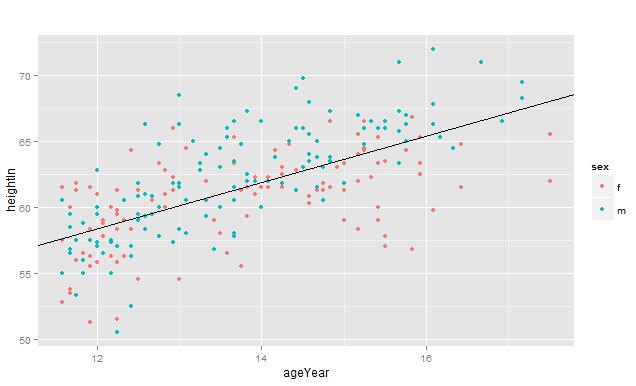
当进行线性回归时,画条拟合直线是个不错的选择。当然有时画水平线和垂直线显示刻度也是可以的。
p <- ggplot(heightweight, aes(x=ageYear, y=heightIn, colour=sex)) + geom_point()
#添加水平线和垂直线
p + geom_hline(yintercept=60) + geom_vline(xintercept=14)
#添加拟合回归线
p + geom_abline(intercept=37.4, slope=1.75)
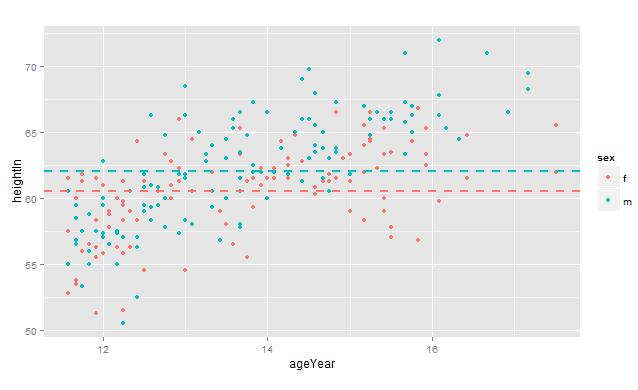
#我们也可以修改直线的类型
library(plyr)
hw_means <- ddply(heightweight, "sex", summarise, heightIn=mean(heightIn))
p + geom_hline(aes(yintercept=heightIn, colour=sex), data=hw_means,linetype="dashed", size=1)
添加分割标记
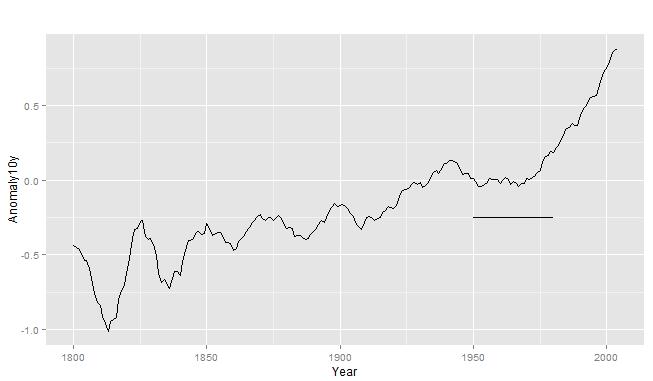
我们使用annotate(“segment”)画分割线。
p <- ggplot(subset(climate, Source=="Berkeley"), aes(x=Year, y=Anomaly10y)) +geom_line()
p + annotate("segment", x=1950, xend=1980, y=-.25, yend=-.25)
添加长方形阴影
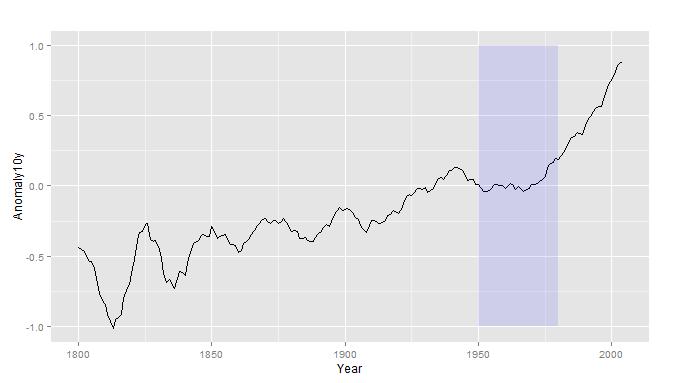
使用annotate(“rect”)函数添加长方形阴影图层。
p <- ggplot(subset(climate, Source=="Berkeley"), aes(x=Year, y=Anomaly10y)) +geom_line()
p + annotate("rect", xmin=1950, xmax=1980, ymin=-1, ymax=1, alpha=.1,fill="blue")
添加误差线
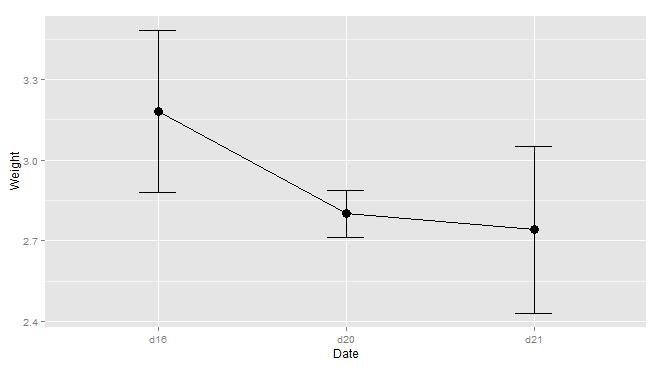
误差线常用于统计学,以显示数据潜在的误差。使用geom_errorbar函数,并需要映射ymin和ymax变量。
ce <- subset(cabbage_exp, Cultivar == "c39")
ggplot(ce, aes(x=Date, y=Weight)) +
geom_line(aes(group=1)) +
geom_point(size=4) +
geom_errorbar(aes(ymin=Weight-se, ymax=Weight+se), width=.2)
给每个小平面增加注释
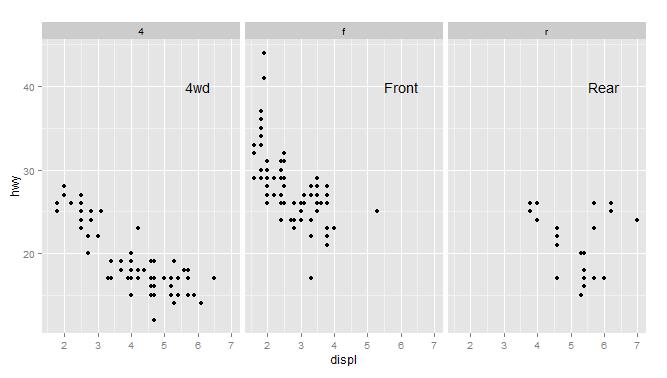
我们根据数据类别画了多个小平面,并想在每个小平面上标上注释。我们可以构造一个数据框,并用geom_text()进行构造。
p <- ggplot(mpg, aes(x=displ, y=hwy)) + geom_point() + facet_grid(. ~ drv)
#构造注释数据框
f_labels <- data.frame(drv = c("4", "f", "r"), label = c("4wd", "Front", "Rear"))
p + geom_text(x=6, y=40, aes(label=label), data=f_labels)
以上为个人经验,希望能给大家一个参考,也希望大家多多支持好代码网。如有错误或未考虑完全的地方,望不吝赐教。

